The purpose of the project was to create a device for measuring vibrations and temperature of mechatronic devices.
Hardware
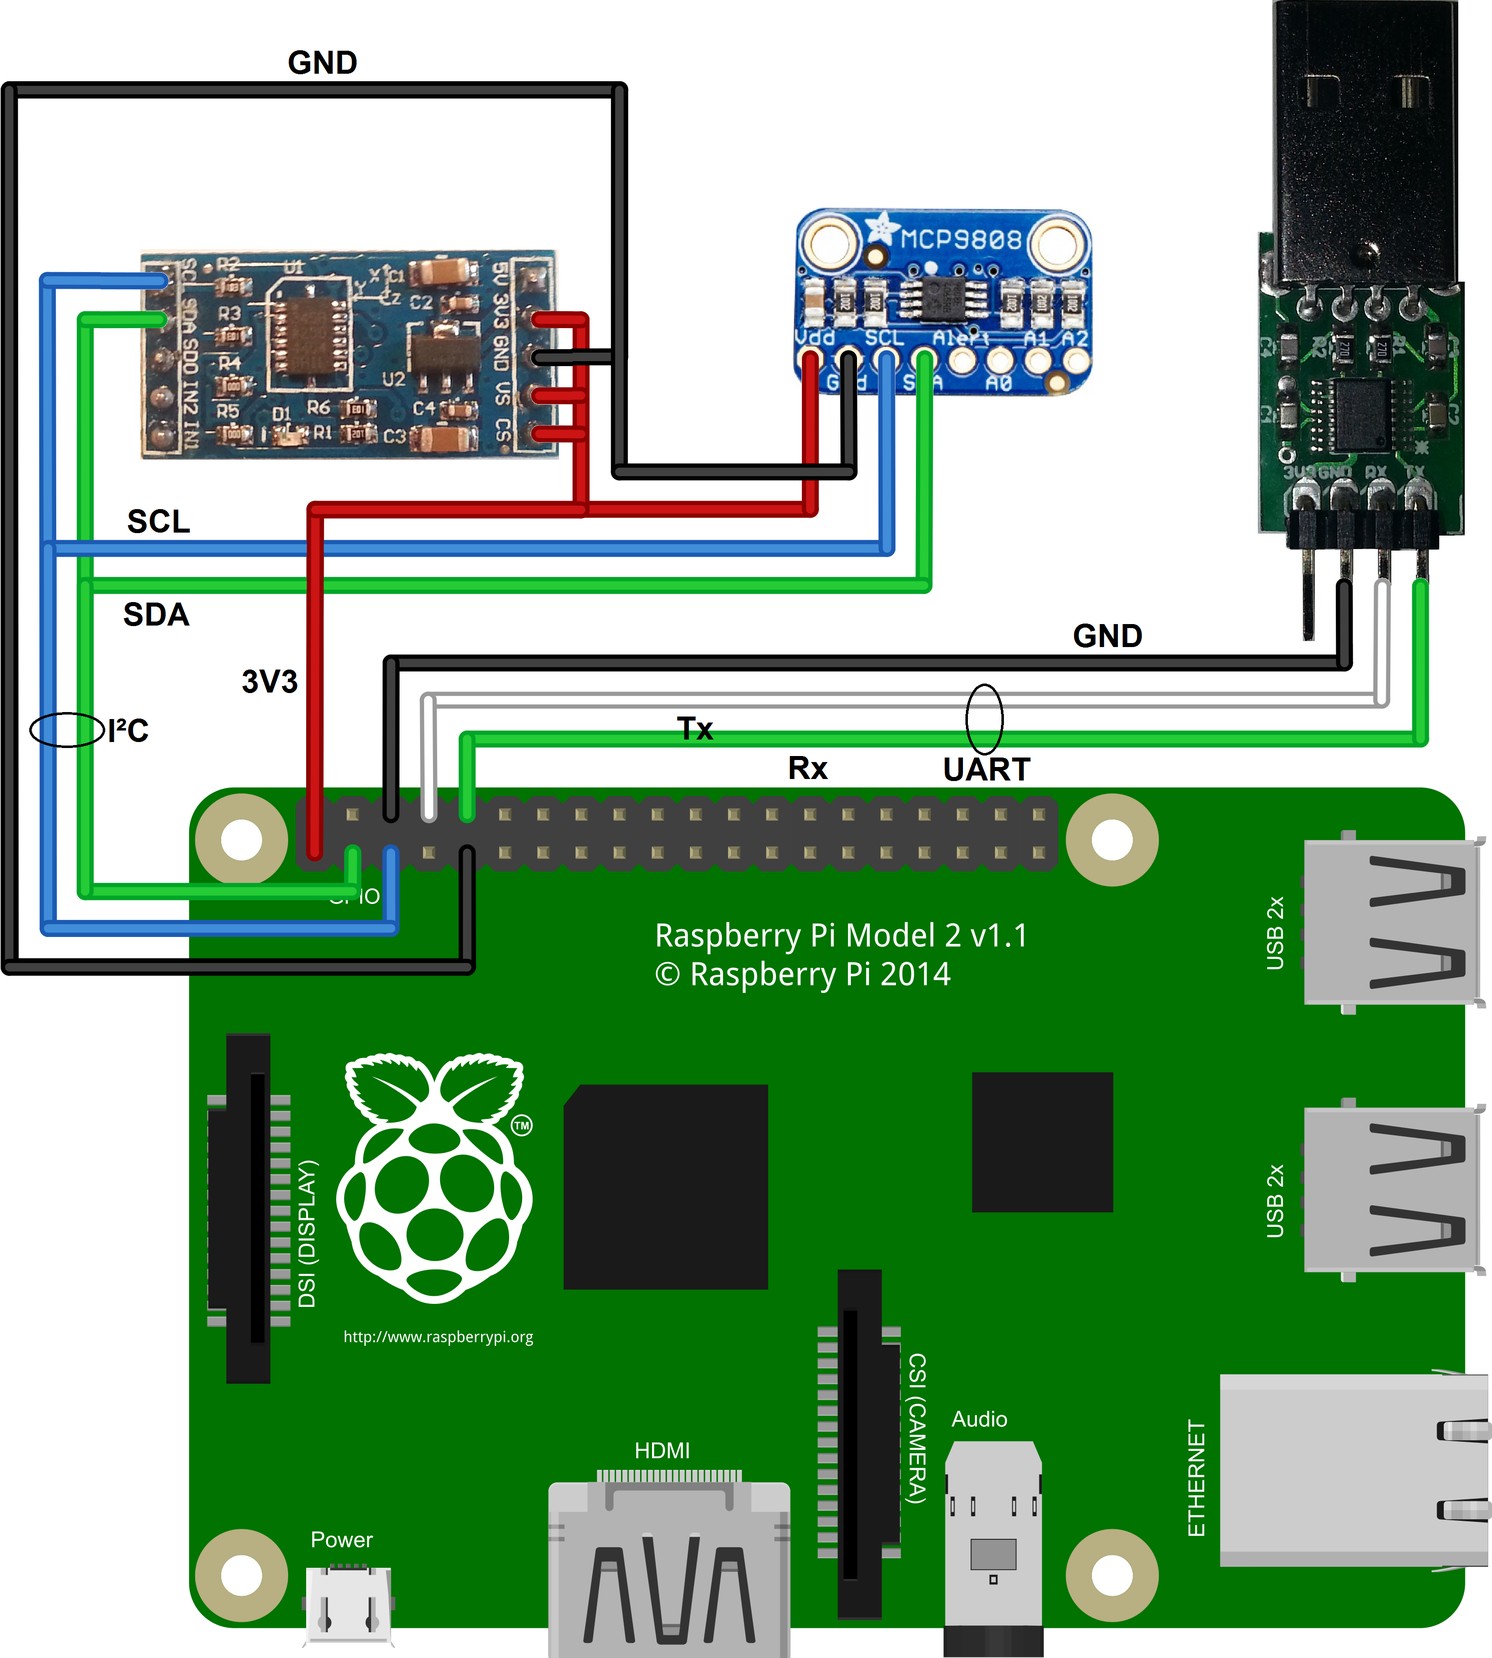
Device consists of Raspberry Pi 2 B single-board computer, ADXL345 accelerometer, MCP9808 temperature sensor and simple USB/UART converter.
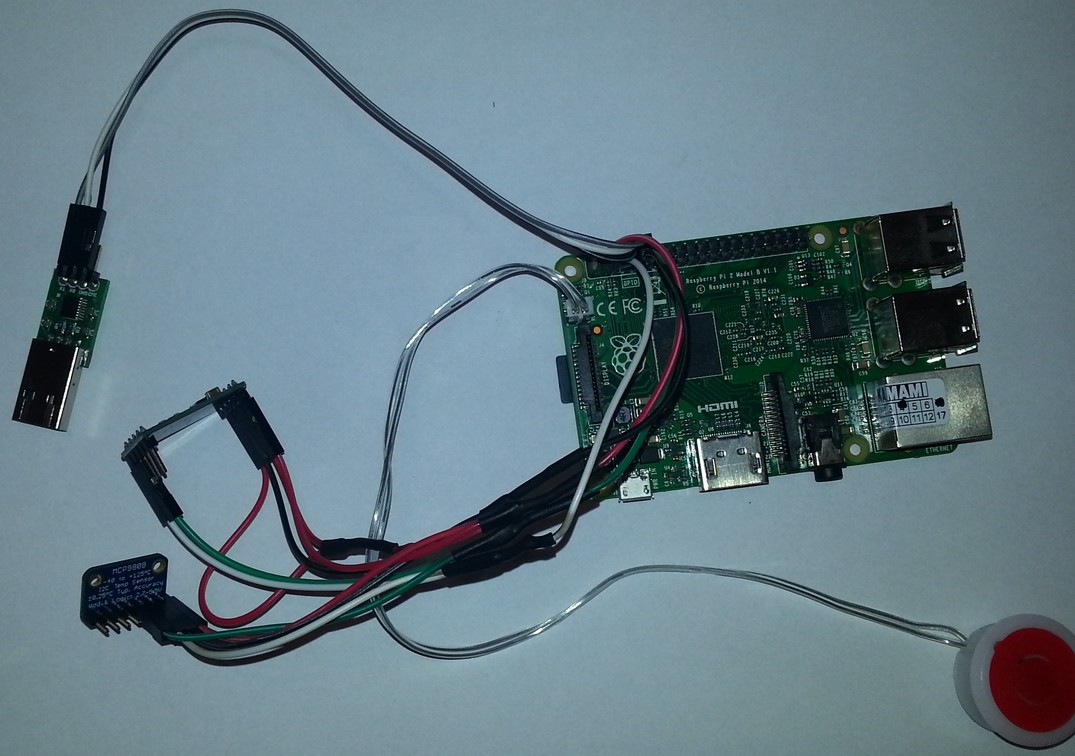
Red button visible on photo above was connected to RUN pins. It allowed to easily reset the device. It was very helpful during development.
Software
Whole software was written in C language.
The project is using RTEMS real-time operating system.
There are 4 threads in program:
- Accelerometer data readout.
- Temperature sensor data readout.
- Modbus thread.
- Data processing.
Scheduling algorithm prioritizes threads in the same order as listed above. Readout threads are executed at regular intervals to ensure proper data collection from sensors.
Thread 1
It uses I²C driver to communicate with the accelerometer. During initialization, range and frequency of measurement are configured and FIFO queue is enabled in the sensor. The internal FIFO in sensor can hold up to 32 samples for each of 3 axes. The thread then periodically reads the collected data. After each readout, it waits until sensor collects about 25 new samples. For 800 Hz sampling frequency it is about 31 ms. Collected acceleration samples are then sent to software FIFO in the device so they can be read by other threads.
Thread 2
It uses I²C driver to communicate with the temperature sensor. No configuration data is sent to the sensor because its default settings are sufficient. The thread periodically reads the collected data. After each readout, it waits until sensor collects new sample. For default settings it is 250 ms. Collected temperature samples are then sent to software FIFO in the device so they can be read by other threads.
Thread 3
It is responsible for communication with PC using UART interface and Modbus protocol. The protocol was implemented using FreeMODBUS library. Thread reads data from FIFOs and shares it as Modbus Input Registers. Measurements are stored in 32-bit float format but Input Registers are 16-bit type, so each measurement is stored in 2 registers. To reduce amount of frames on interface with PC, acceleration and velocity measurements are stored in registers in a series of 20. This whole data can be read with only one Modbus request frame.
Modbus Input Registers of the device:
| Address | Registers | Content | Unit |
|---|---|---|---|
| 0x0000 | 2 | System time | s |
| 0x0002 | 40 | Acceleration - X-axis | m/s² |
| 0x002A | 40 | Acceleration - Y-axis | m/s² |
| 0x0052 | 40 | Acceleration - Z-axis | m/s² |
| 0x007A | 40 | Velocity - X-axis | mm/s |
| 0x00A2 | 40 | Velocity - Y-axis | mm/s |
| 0x00CA | 40 | Velocity - Z-axis | mm/s |
| 0x00F2 | 2 | RMS acceleration - X-axis | m/s² |
| 0x00F4 | 2 | RMS acceleration - Y-axis | m/s² |
| 0x00F6 | 2 | RMS acceleration - Z-axis | m/s² |
| 0x00F8 | 2 | RMS velocity - X-axis | mm/s |
| 0x00FA | 2 | RMS velocity - Y-axis | mm/s |
| 0x00FC | 2 | RMS velocity - Z-axis | mm/s |
| 0x00FE | 2 | Peak-to-peak acceleration - X-axis | m/s² |
| 0x0100 | 2 | Peak-to-peak acceleration - Y-axis | m/s² |
| 0x0102 | 2 | Peak-to-peak acceleration - Z-axis | m/s² |
| 0x0104 | 2 | Acceleration kurtosis - X-axis | - |
| 0x0106 | 2 | Acceleration kurtosis - Y-axis | - |
| 0x0108 | 2 | Acceleration kurtosis - Z-axis | - |
| 0x010A | 2 | Temperature | °C |
Additionaly the device has Holding Registers. They store configuration data.
Modbus Holding Registers of the device:
| Address | Registers | Content | Unit |
|---|---|---|---|
| 0x0000 | 1 | Acceleration measurement frequency | Hz |
| 0x0001 | 1 | Statistical calculations step time | ms |
| 0x0002 | 1 | Mode | - |
Thread 4
It reads acceleration measurements from FIFO of Thread 1. Using this data it calculates velocity and statistical data: RMS of acceleration, RMS of velocty, peak-to-peak amplitude of acceleration and kurtosis of acceleration. Step time of these calculations is defined by user. Results are written to FIFOs from where they will be read by Thread 3.
Diagram below shows the flow of data:

Data processing
The data from accelerometer is processed to obtain velocity and statistical data.
Velocity
First, the high-pass filter with 10 Hz cutoff frequency is applied to acceleration signal. Fourth-order Butterworth filter was used. It was implemented as digital IIR filter. For 800 Hz signal its transfer function is show below:
and Bode plot:

Next, the average value is subtracted from the signal. Average value is calculated using formula:

where:
- xₙ - signal sample
- n - previous number of samples
- CMAₙ - average value of signal
Next, the signal is integrated using formula:

where:
- yₙ - integrated signal
- fₛ - sampling frequency
Next, the average signal is again subtracted from the signal and it is calculated with the same formula as before. Last step is to multiply the signal by 1000 to convert to mm/s.
Statistical data
To calculate root mean square of acceleration and velocity I used the following formula:

where:
- xₙ - signal sample
- N - number of samples
To calculate peak-to-peak amplitude of acceleration I subtracted min sample from max sample in defined time window.
To calculate kurtosis of acceleration I used the following formula:

where:
- xₙ - signal sample
- N - number of samples
- x̅ - average value of signal
Measurements
I did some measurements on common household appliances. The first was an electric kettle.

Graph of acceleration and RMS of one of the axes is shown below.
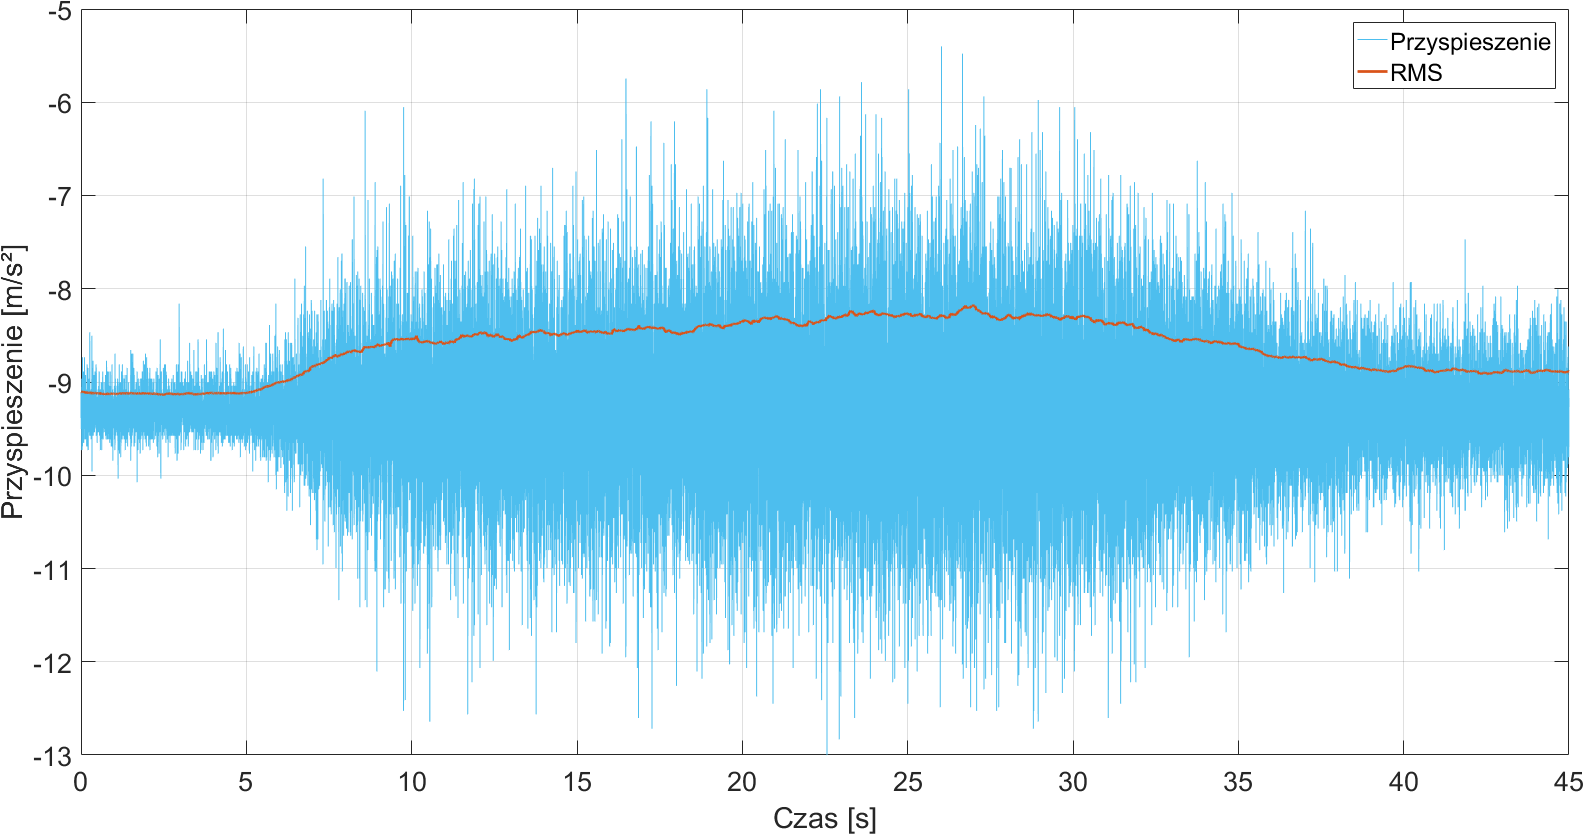
After 5 s of measurement, it is clearly visible that the vibration amplitude begins to increase. By 30 s, the vibrations will increase all the time and then begin to weaken, until 40 s, where they remain constant. Then the water starts to boil and after a while the kettle turns off. An increase of amplitude in 5 s means that the heating element in the kettle has reached the boiling point of the water. Air and water vapor bubbles appear around the heating element. As they escape into the cold water above, they collapse. As these bubbles form and collapse, the noise and vibrations are generated as shown in the graph. At 30 s, all the water in the kettle begins to boil and the above phenomenon is getting weaker. After 40 s, all the water in the kettle boils, emitting much weaker vibrations.

In the above spectrogram you can see the starting of boiling water. At 5 s, vibrations with a very wide spectrum appear. The most visible is the frequency range from 150 Hz upwards. In 30 s, these vibrations rapidly weaken, and vibrations with a frequency of about 60 Hz become distinct.
The second tested appliance was a lawn mower.

Below are graphs of the acceleration of each axis and a graph comparing the RMS of all axes.


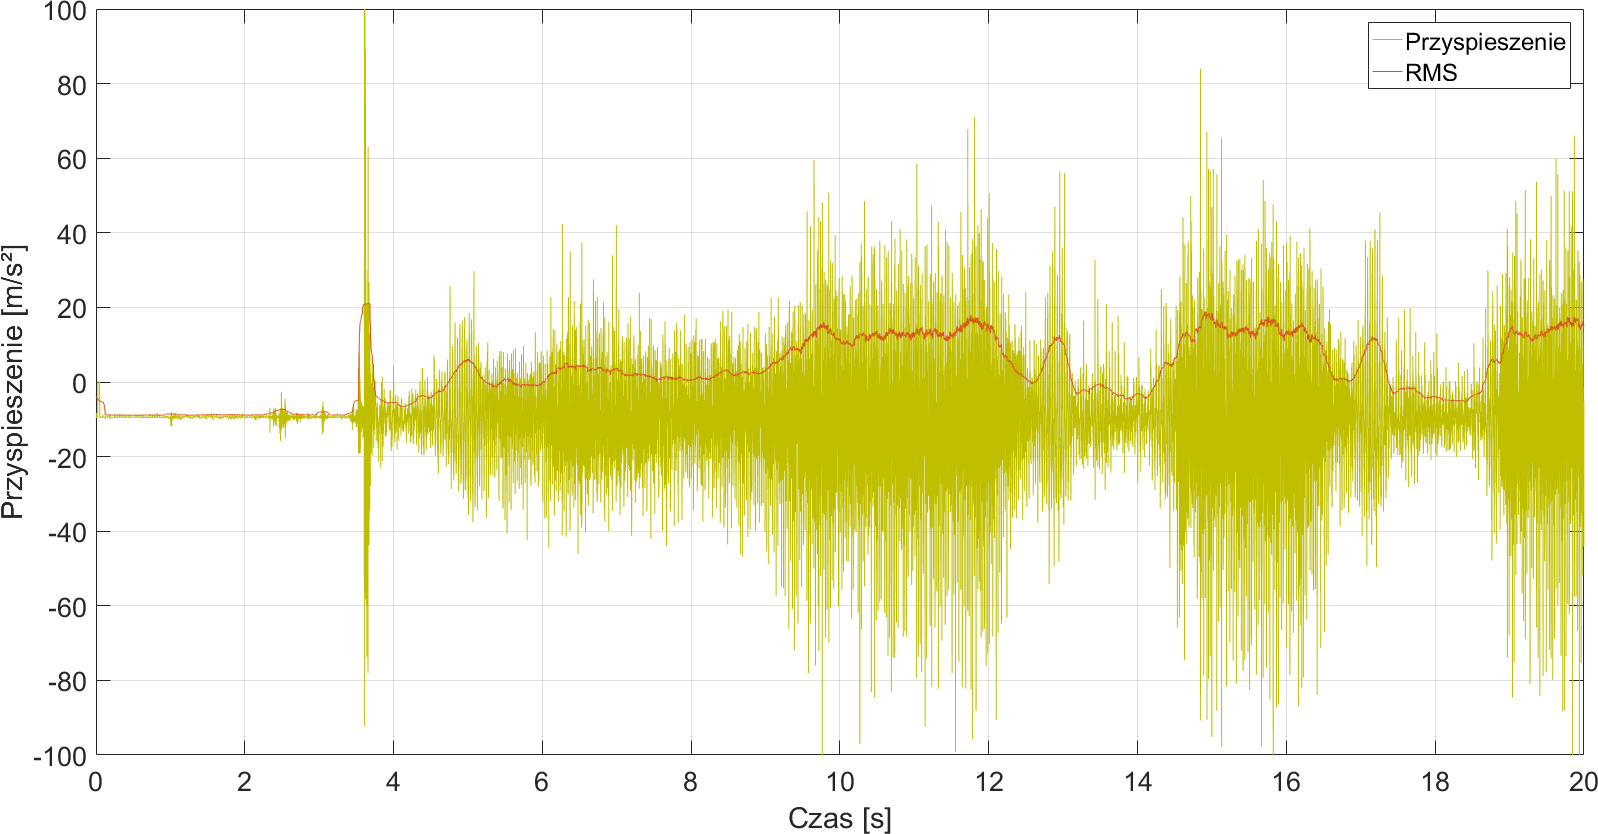

Just before 4 s, the mower starts.
Engine reaches highest speed before 10 s and at 12 s, its speed is reduced.
The cycle is repeated several times.
Graphs clearly show changes in the vibration amplitude depending on the mower engine speed.
Graphs of the amplitude spectrum for the measurement fragments during higher(left) and lower(right) engine revolutions are presented below.


During higher revolutions the frequency of about 44 Hz becomes noticeable. During lower revolutions the frequency of about 25 Hz becomes noticeable.
The following spectrogram shows clear changes in the amplitude spectrum during the measurement.

The last tested appliance was a fan with a weight attached to one of its blades. The purpose of the weight was to reduce the balance and increase the vibration amplitude.

Acceleration graph for all axes is shown below.

The graph shows very regular oscillations. Velocity graph is shown below.

It is even more regular than the acceleration signal.
Graph of the amplitude spectrum is shown below.
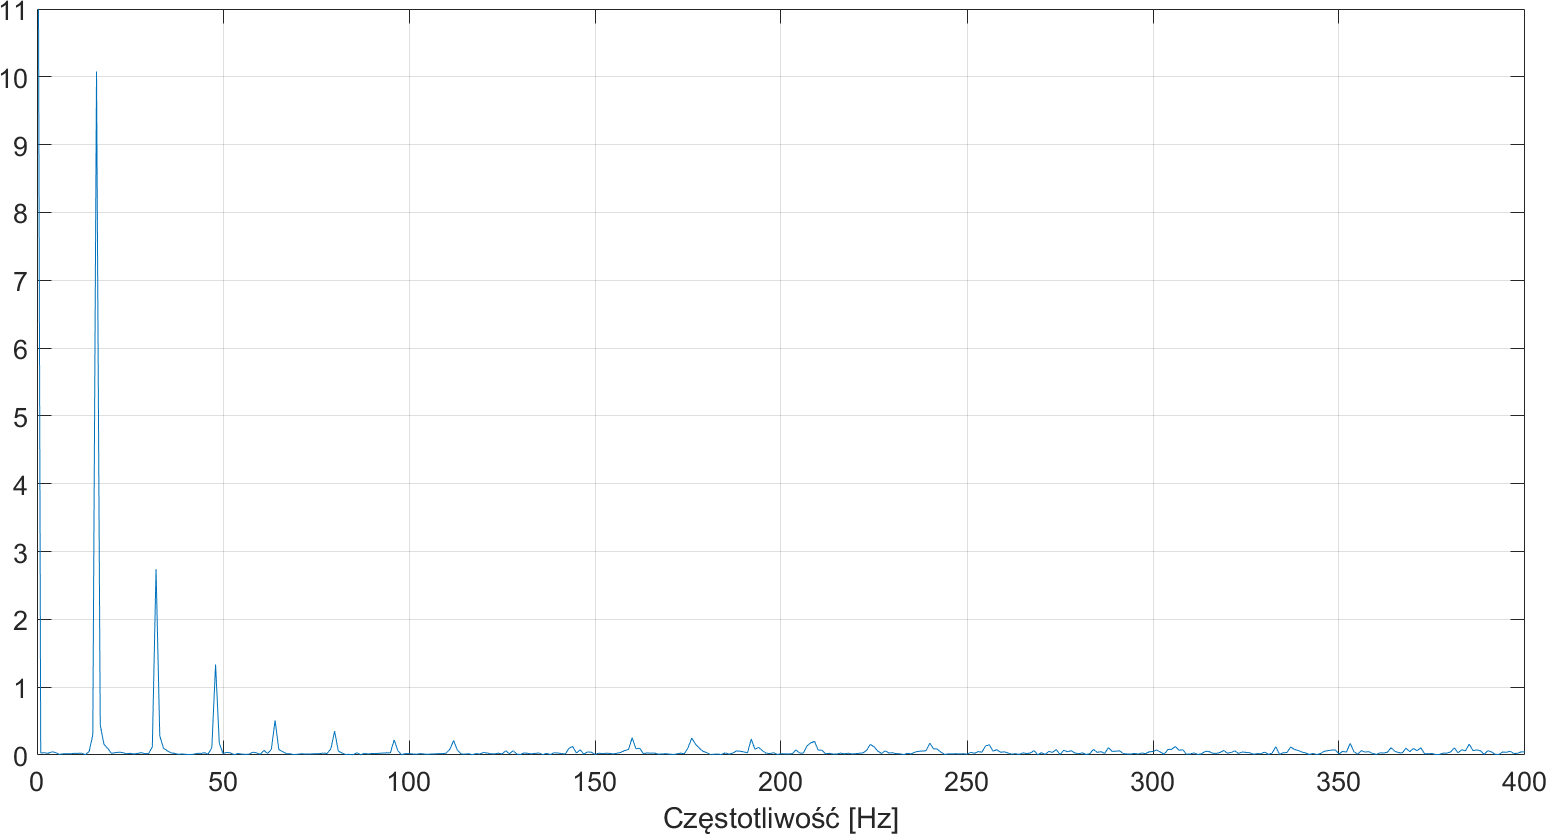
The graph clearly shows frequency of 16 Hz and its successive harmonics.
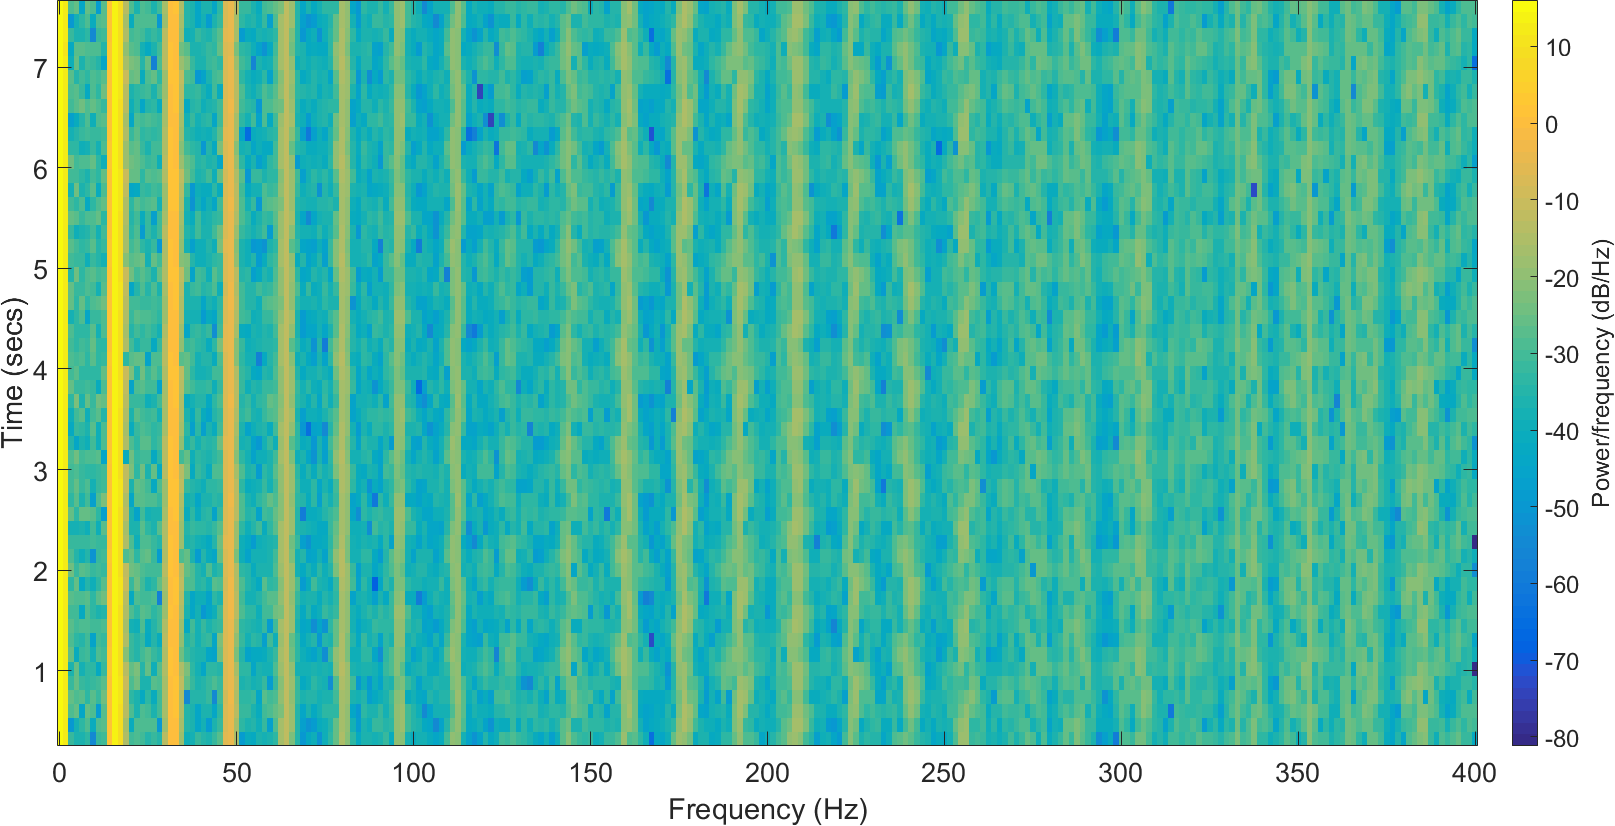
In the above spectrogram, the visible main frequency and its harmonics remain unchanged during the entire measurement time.
How to run the software
Setting up an RTEMS development environment
Thanks to the Alan’s Tech Notes I managed to set up development environment properly on Ubuntu 16.04 64-bit.
Steps:
mkdir -p $HOME/development/rtems/compiler
cd $HOME/development/rtems

git clone git://git.rtems.org/rtems-source-builder.git
cd rtems-source-builder
source-builder/sb-check
You should see something like:
RTEMS Source Builder - Check, 4.12 (1c68dbb29392)
Environment is ok
cd rtems
../source-builder/sb-set-builder --log=build-log.txt --prefix=$HOME/development/rtems/compiler/4.12 4.12/rtems-arm
It will take a while.
After successful build, edit .profile in your $HOME directory and add:
PATH=$HOME/development/rtems/compiler/4.12/bin:$PATH
Then execute:
source $HOME/.profile
After entering:
arm-rtems4.12-gcc -v
You should see compiler version.
Now follow next steps:
cd $HOME/development/rtems
git clone git://git.rtems.org/rtems.git rtems-git

cd rtems-git
./bootstrap

cd $HOME/development/rtems
mkdir build-rtems-rpi
cd build-rtems-rpi
../rtems-git/configure --target=arm-rtems4.12 --enable-rtemsbsp=raspberrypi2 --enable-tests=samples --enable-networking --enable-posix --prefix=$HOME/development/rtems/bsps/4.12
make install
Now again edit .profile in $HOME directory and add:
export RTEMS_MAKEFILE_PATH=$HOME/development/rtems/bsps/4.12/arm−rtems4.12/raspberrypi2
And again execute:
source $HOME/.profile
Now environment should be ready.
Compiling the project
Execute the following commands:
cd
git clone https://github.com/loruro/RPi_Vibration_Measurement.git
cd RPi_Vibration_Measurement/src
./dev_makescript
Executed script creates .ralf file with system image. It will be located in ./o-optimize/ and also in TFTP server root directory (description here).
Now there are 2 options to run the software on Raspberry Pi. By booting directly from SD card or using U-Boot to load image from TFTP server.
Boot from SD card
Follow these steps:
- Format SD card to FAT32.
- Prepare system image file (described above) and change its name to kernel.img. Save it on SD card.
- Go to https://github.com/raspberrypi/firmware/tree/master/boot and download bootcode.bin and start.elf. Put those files on SD card.
- Insert SD card in Raspberry Pi and power-up. The device should boot up properly.
Boot from TFTP server by using U-Boot
Booting directly from SD card everytime you change something during development process would be extremely tedious. I used the U-Boot bootloader to ease the development. It is software located on SD card, which after power up uses Ethernet interface to communicate with TFTP server on local network and download target system image. You can use your computer as TFTP server. On Ubuntu 16.04 64-bit execute command:
sudo apt−get install tftpd−hpa
This will install and automatically start TFTP server. It will share files located in /var/lib/tftpboot. This is where our system image file should be located.
To use U-Boot, you need to download and compile it first. Cross-compiler is needed for this:
sudo apt−get install gcc-arm-linux-gnueabi
Now download sources and compile:
git clone git://git.denx.de/u−boot.git
export CROSS_COMPILE=arm−linux−gnueabi−
make rpi_2_defconfig
make −j
This will create u-boot.bin file. Change its name to kernel.img and follow the steps described in chapter about booting image directly from SD card.
Connect Raspberry Pi to your local network with Ethernet cable.
Use terminal to connect to serial port of USB/UART converter and power-up the device.
If you can see U-Boot printing something on your terminal, it means that everything went well.
Now, during booting process of U-Boot, click any button to stop it from executing its default script.
If you missed it and the device is not responding, just reset Raspberry Pi.
Now type those commands:
set env bootcmd "dhcp 192.168.0.2:kernel.img;bootm"
saveenv
Replace 192.168.0.2 with address of your TFTP server.
Now, everytime you power-up the device, it should connect to the server, load system image and boot it.
Desktop application
Desktop computer is used to retrieve data from the device. For this purpose, an application was created, which is described here.
Conclusion
I managed to create a working device and fulfill the project assumptions. The device is easy to use thanks to an intuitive desktop application.
The limitations in the project were lack of full documentation of Raspberry Pi platform, lack of full Raspberry Pi support by RTEMS and low bandwidth of UART interface. Using U-Boot bootloader greatly sped up the development.

RPi Vibration Measurement by Karol Leszczyński is licensed under a Creative Commons Attribution-ShareAlike 4.0 International License.