Purpose of the project was to connect STM32F4 Discovery board to two pressure sensors:
- BMP180 placed on BOOSTXL-SENSHUB board
- MPL115A1 placed on KAmodBAR-SPI board
perform some measurements and compare both sensor.
STM32F4 Discovery board has STM32F407VGT6 microcontroller with ARM Cortex-M4 core. The board also includes ST-LINK/V2 debugger and multiple sensors which are not used in this project.
To communicate with PC I used UART interface. Between Discovery board and PC there was a simple USB/UART converter. All output from board could be easily read in terminal application.
Schematic of all connections between boards is here.

Specification taken from datasheets:
| MPL115A1 | BMP180 | |
|---|---|---|
| Range | 500-1150 hPa | 300-1100 hPa |
| Accuracy | ±10 hPa | ±0,12 hPa |
| Resolution | 1.5 hPa | 0.01 hPa |
| Interface | SPI | I²C |
| Supply voltage | 2.375 V – 5.5 V | 1.8 V – 3.6 V |
| Operating Temperature Range | -40 °C to +105 °C | -40 °C to +85 °C |
As we can see, datasheets declare that BMP180 is much better in terms of accuracy and resolution than MPL115A1.
Software
Software for STM32 uses STM32CubeF4 1.13.0 libraries and files generated by STM32CubeMX 4.16.0 application.
Procedure of measuring pressure was based upon sensors datasheet.
First thing is to read calibration coefficients stored inside both of sensors. These coefficients are unique for every piece of sensor. They are read once, at the program initialization. They will be needed later.
Second thing is to send control command to sensor so it will start temperature and pressure conversion (both sensors measure temperature because it is necessary for correct pressure calculation).
In case of MPL115A1, there is one command which starts conversion of both pressure and temperature. After 3 ms both values are ready and can be read from sensor.
In case of BMP180, there are separate commands for pressure and temperature conversion. Both conversions store measured value inside the same register so it have to be read after each conversion. Conversion time for temperature equals 4.5 ms. In case of pressure, conversion command contains value specifying accuracy of measurement. It is called oversampling rate and it ranges between 0 and 3. Conversion time depends on this value and ranges between 4.5 ms and 25.5 ms.
In this project I used simple delay function to wait for an end of pressure and temperature conversions. Because of simplicity of program, this approach works correctly. For more complex applications delay functions are unacceptable and different methods should be used (e.g. timers, interrupts).
After successful conversion, correct value of pressure has to be calculated. Formulas are given in datasheets. For these calculations all data previously read from sensor is used: pressure, temperature and coefficients. As a bonus, correct value of temperature measured by BMP180 sensor can also be calculated. Thanks to proper formula inside datasheet.
To increase accuracy, arithmetic mean value is calculated of every 16 measurements. Afterwards, values are sent to PC by UART interface.
After each measurement, state of LEDs on Discovery board is changed so the light jumps and draws circlelike shape.
There is also simpe error handling implemented. If error occurs (e.g. connection between Discovery board and sensor brokes), program will stop performing measurements and will blink onboard LEDs.
Tests
For the most of the tests, BMP180 used oversampling rate 3.
First test was to compare both sensors with commercial, home weather station.
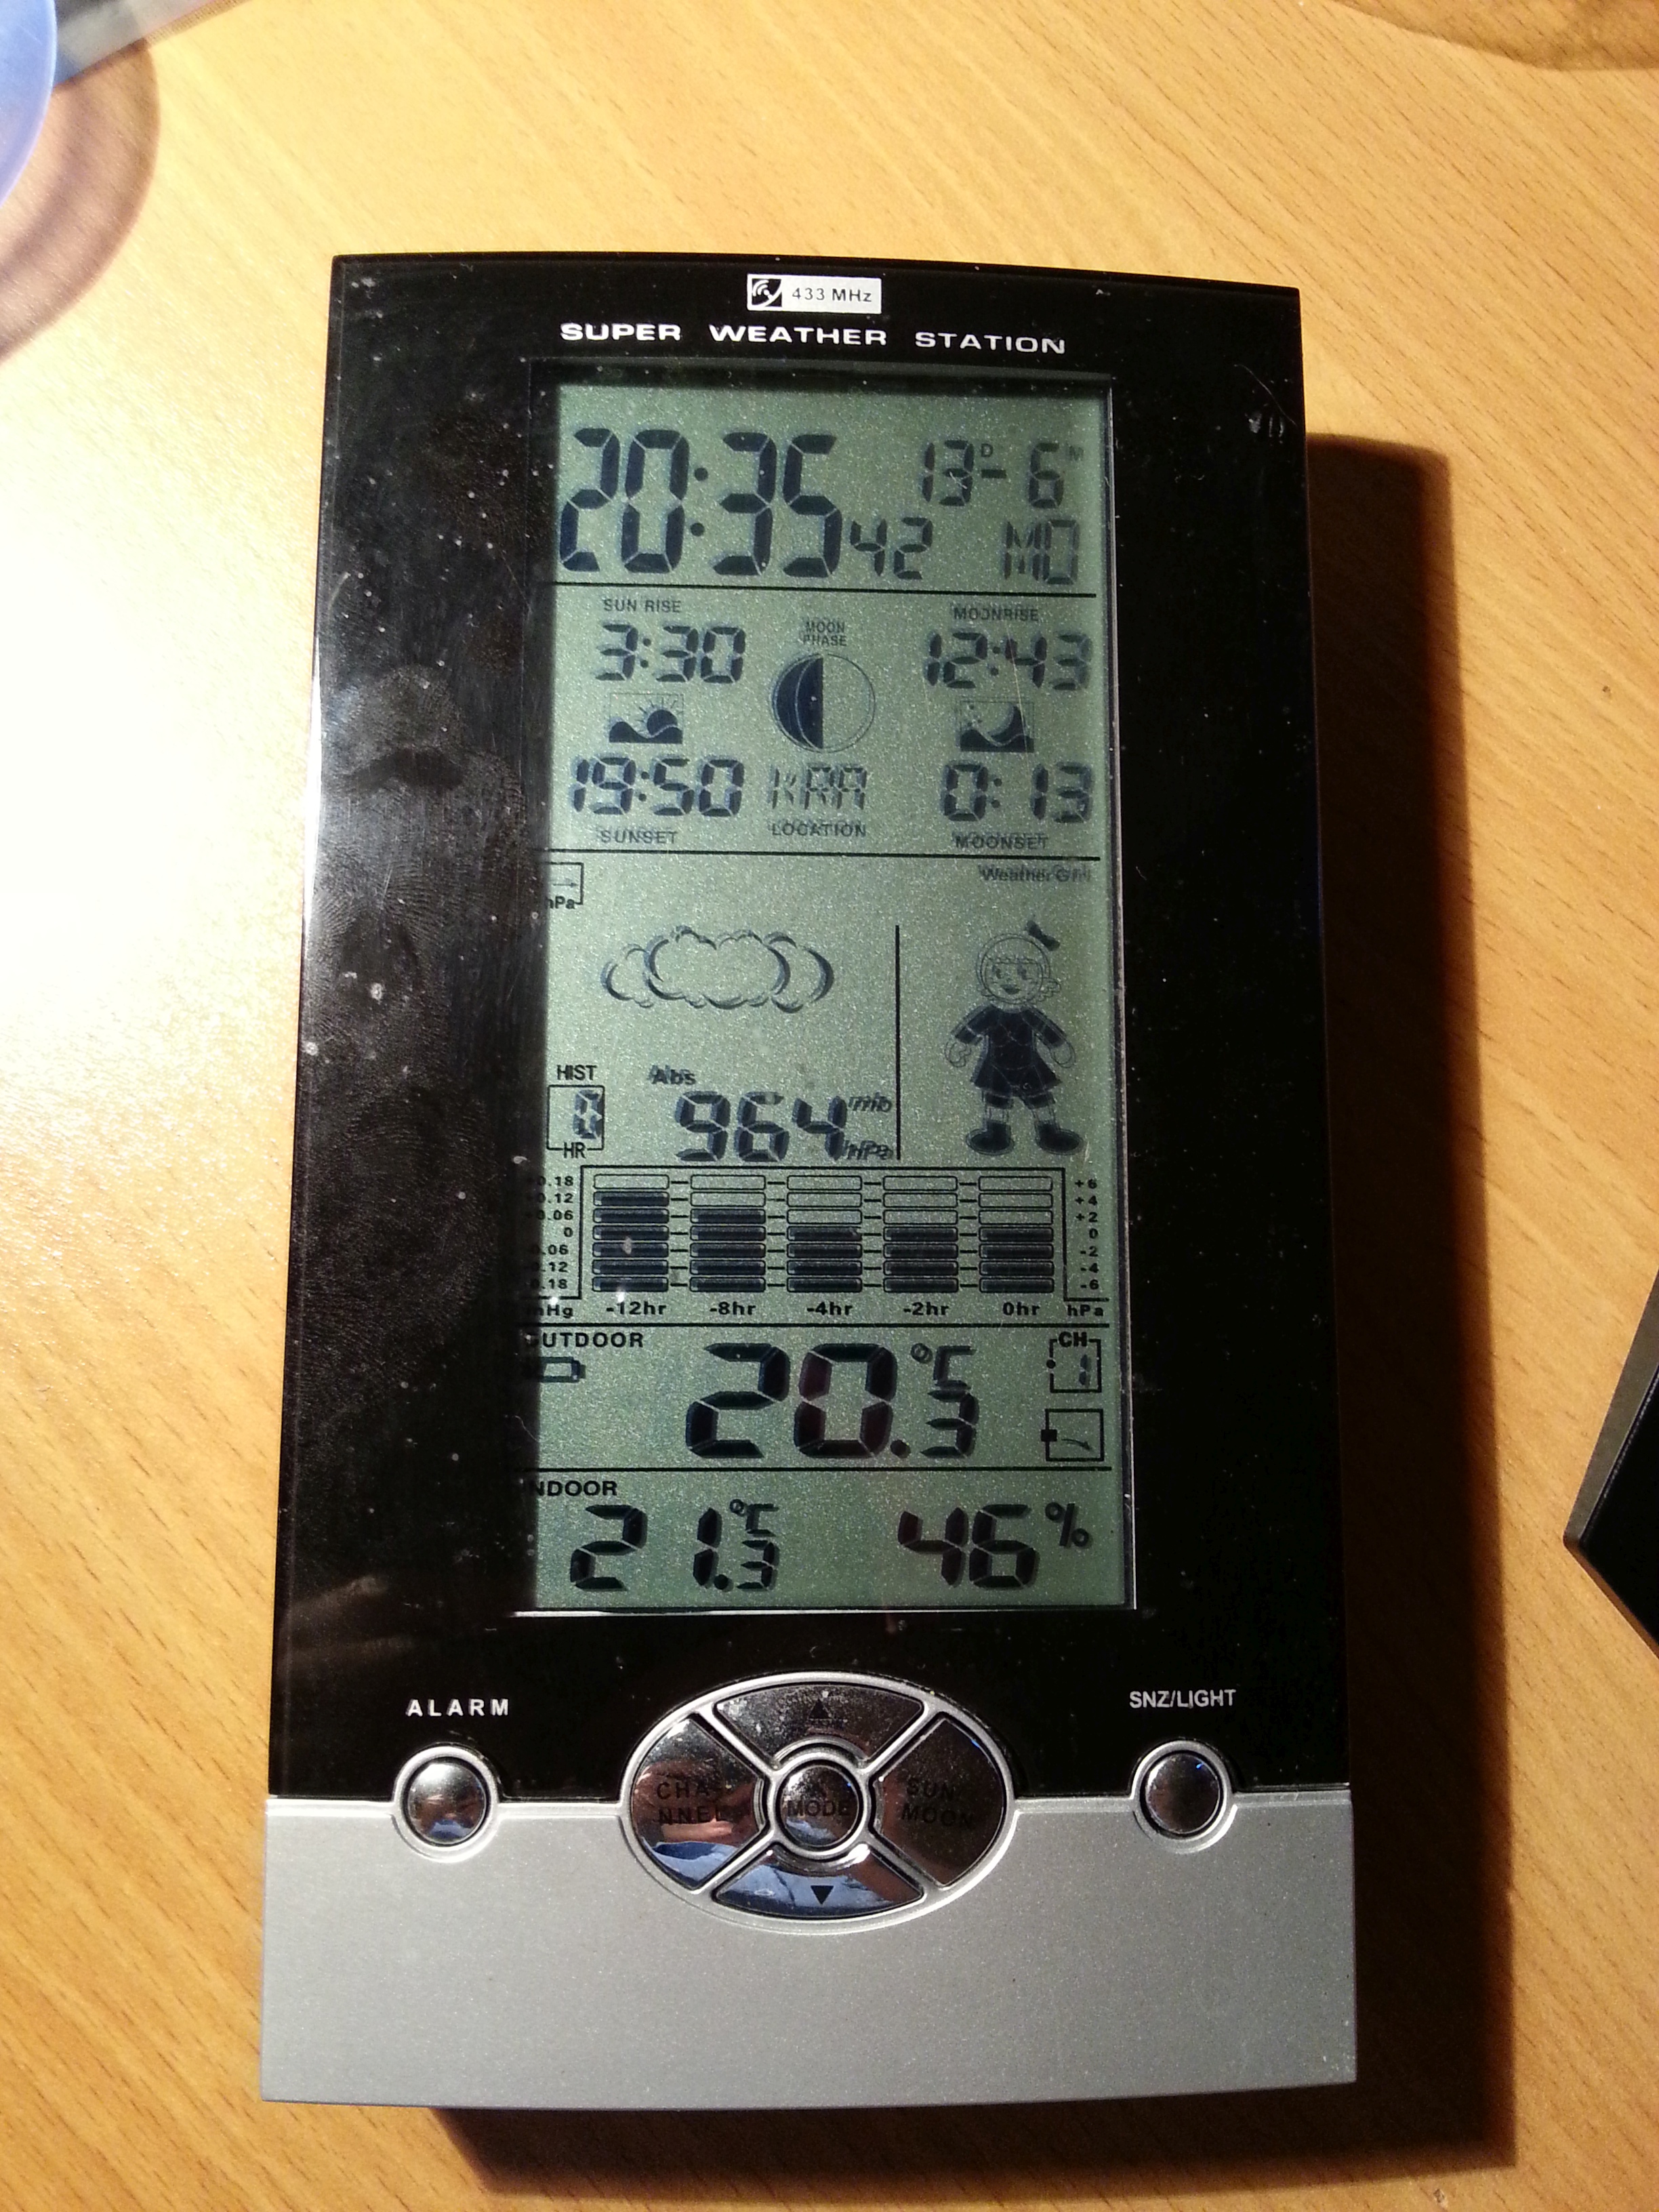
Measurements for all devices were done in the same time:
| Pressure | Temperature | |
|---|---|---|
| MPL115A1 | 967 hPa | — |
| BMP180 | 973 hPa | 24.9 °C |
| Weather station | 964 hPa | 23.0 °C |
All devices gave different results. I couldn’t decide which was the most correct.
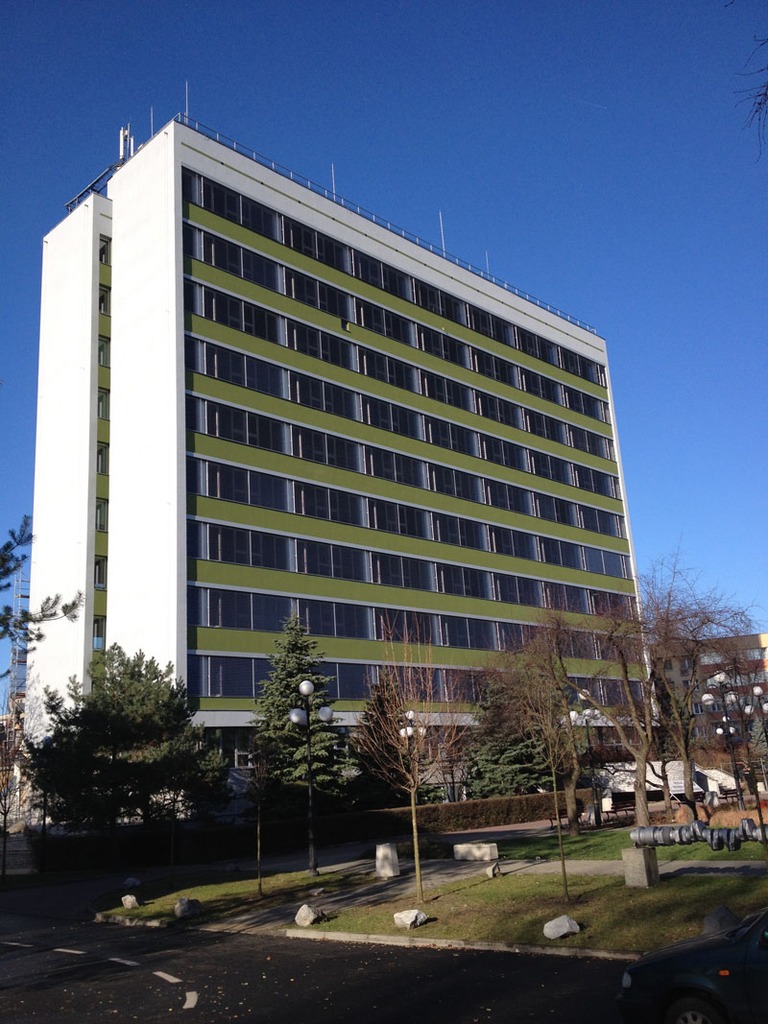
Second test involved comparing results of MPL115A1 and BMP180 sensors while altitude was changing. I chose two relatively high buildings inside the campus of my university AGH University of Science and Technology:
 |
 |
|---|---|
| Kapitol Source: Wikipedia |
B5 Source: skyscrapercity.com |
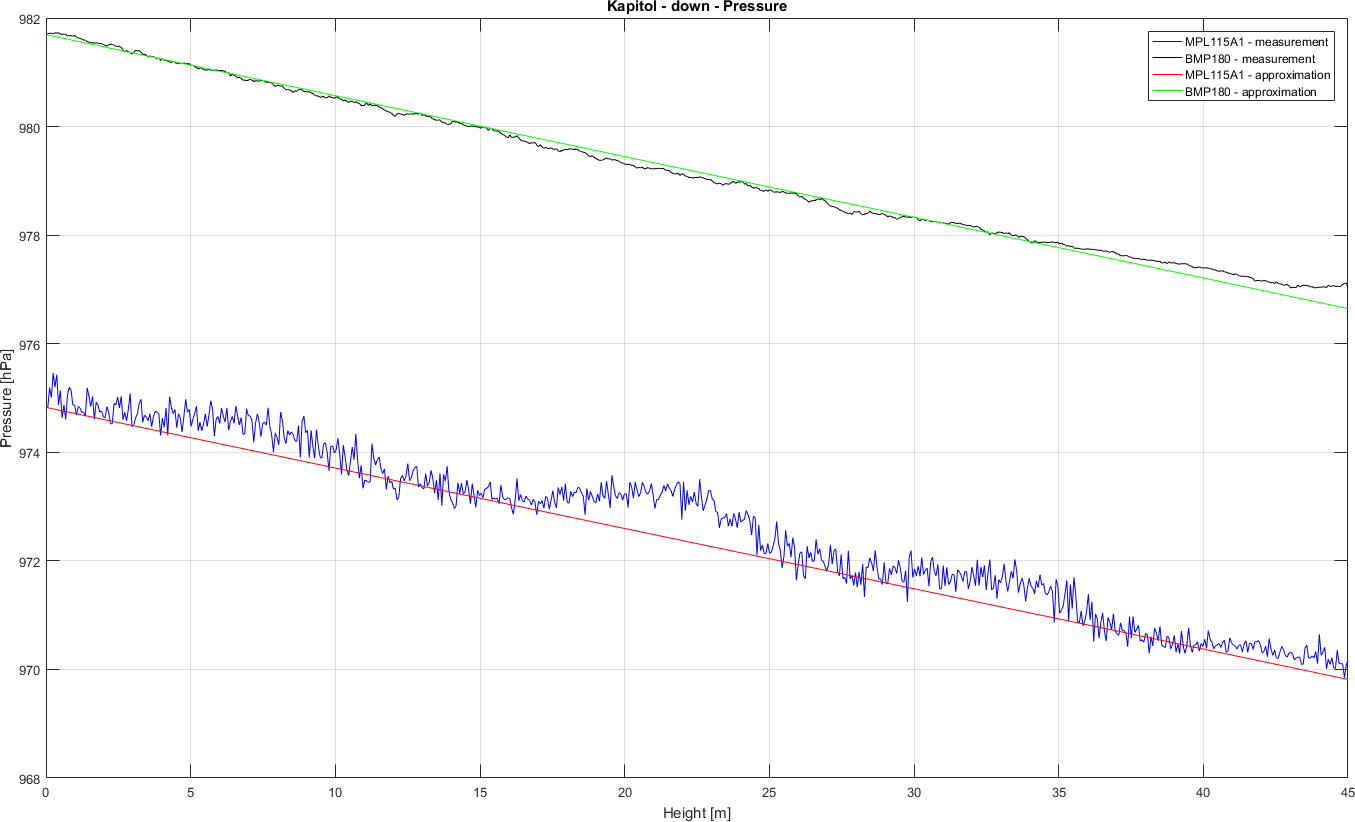
Measurements was made while going up and down the stairs. Charts are generated by MATLAB script. I compared measured values with values approximated by barometric formula:
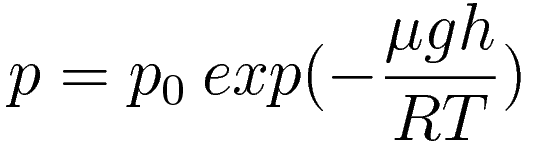
where:
- p₀ - atmospheric pressure at reference point
- μ - molar mass of air (0,0289644 kg/mol)
- g - gravitational acceleration (9.80665 m/s²)
- h - current altitude
- R - gas constant (8.3144598 J/(mol*K))
- T - temperature in Kelvins
Results:
| Pressure | Temperature |
|---|---|
 |
 |
 |
 |
 |
 |
 |
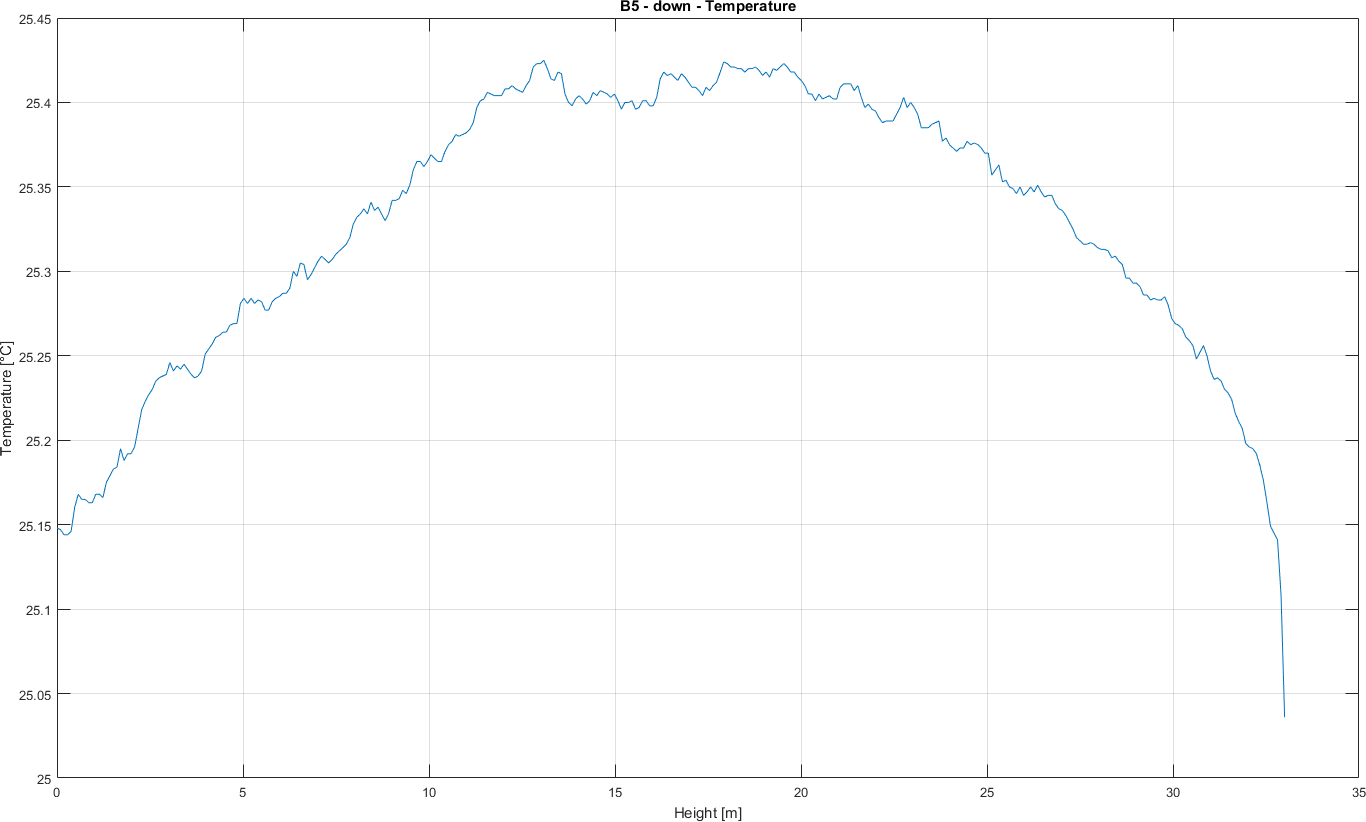 |
As we can see, measurements from BMP180 were much more stable. There is significant offset between sensors. Also the curve created from barometric formula is quite well aligned for both sensors.
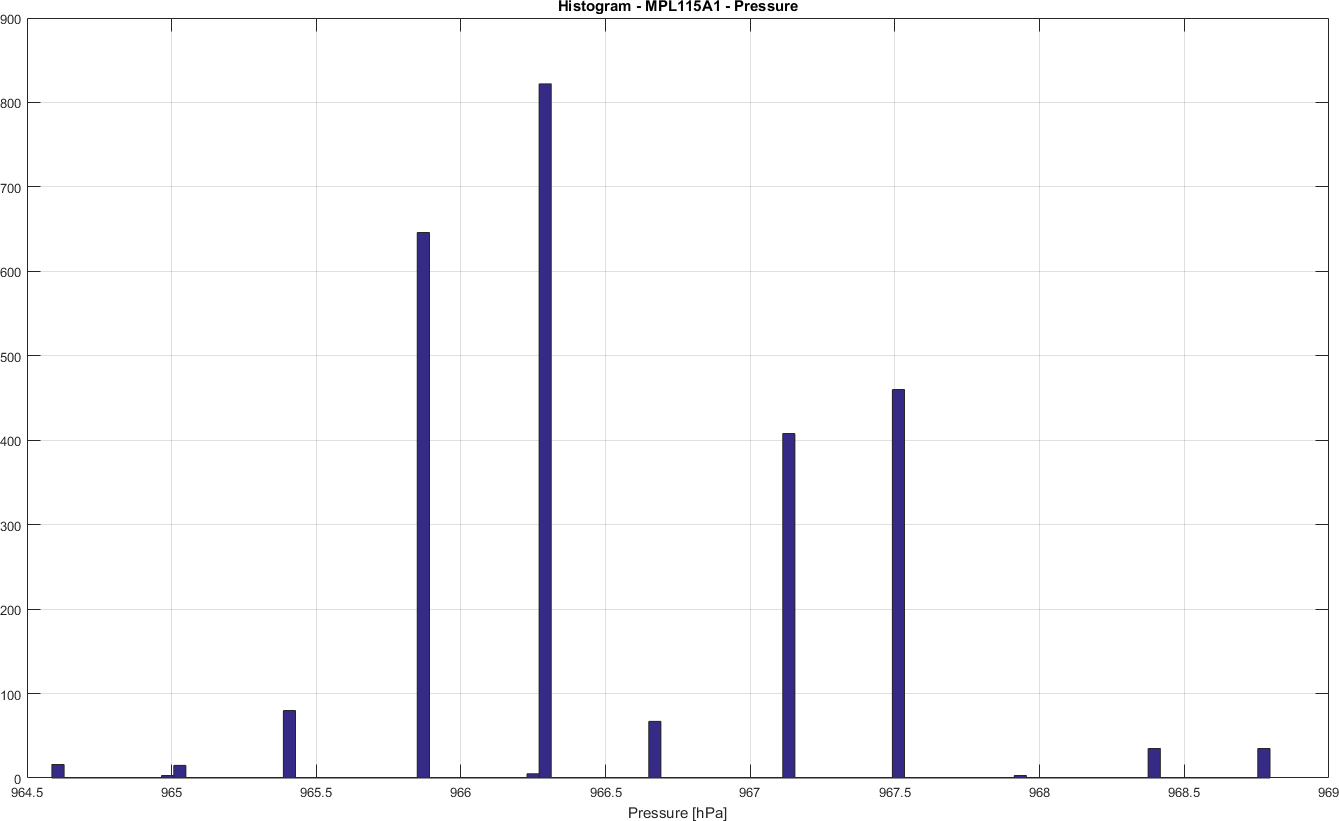
Third test involved leaving both sensors in stable environment for a few minutes. Arithmetic mean value calculation of 16 samples was disabled. Different oversampling rate of BMP180 was checked during test. Results were displayed in form of histograms:
 |
 |
|---|---|
 |
 |
 |
 |
Some of the expected values are visibly missing. Also most of the histograms do not look like normal distribution. Only the histogram of BMP180 sensor with oversampling rate of 3 looks almost like Gaussian bell. This could be caused by a bug in software, hardware or not proper power supply of pressure sensors.
Conclusion
Both sensors worked as expected and were consistent with their datasheets. Tests proved that BMP180 sensor is much more accurate than MPL115A1.
STM32F4 Discovery board did the job. Programming with popular HAL libraries was unexpectedly easy.
Writing software for these pressure sensors was a pleasant experience and teached me something new about technology in our everyday life.